
Grafana: Monitoring and Visualization

Grafana: A Powerful Monitoring and Visualization Tool
Grafana is an open-source analytics and monitoring platform that allows users to visualize, analyze, and alert on data from various sources. Whether it’s system performance, business metrics, or application health, Grafana provides interactive dashboards that help teams make data-driven decisions in real time.
At our company, we've integrated Grafana into our workflow as a key tool for monitoring, alerting, and visualizing critical metrics. From system health checks to business analytics, Grafana enables us to track everything in real-time, quickly detect issues, and optimize our operations. Here’s how we use Grafana to monitor the pulse of our infrastructure and business:
Real-Time Monitoring and Alerts
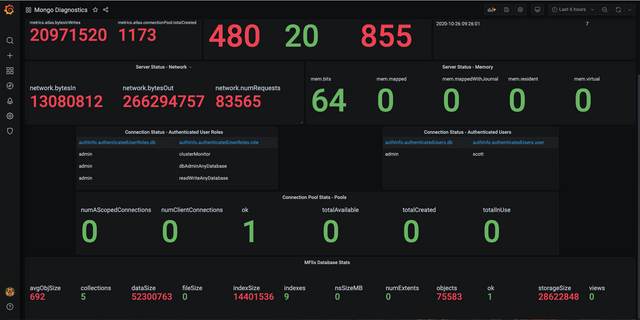
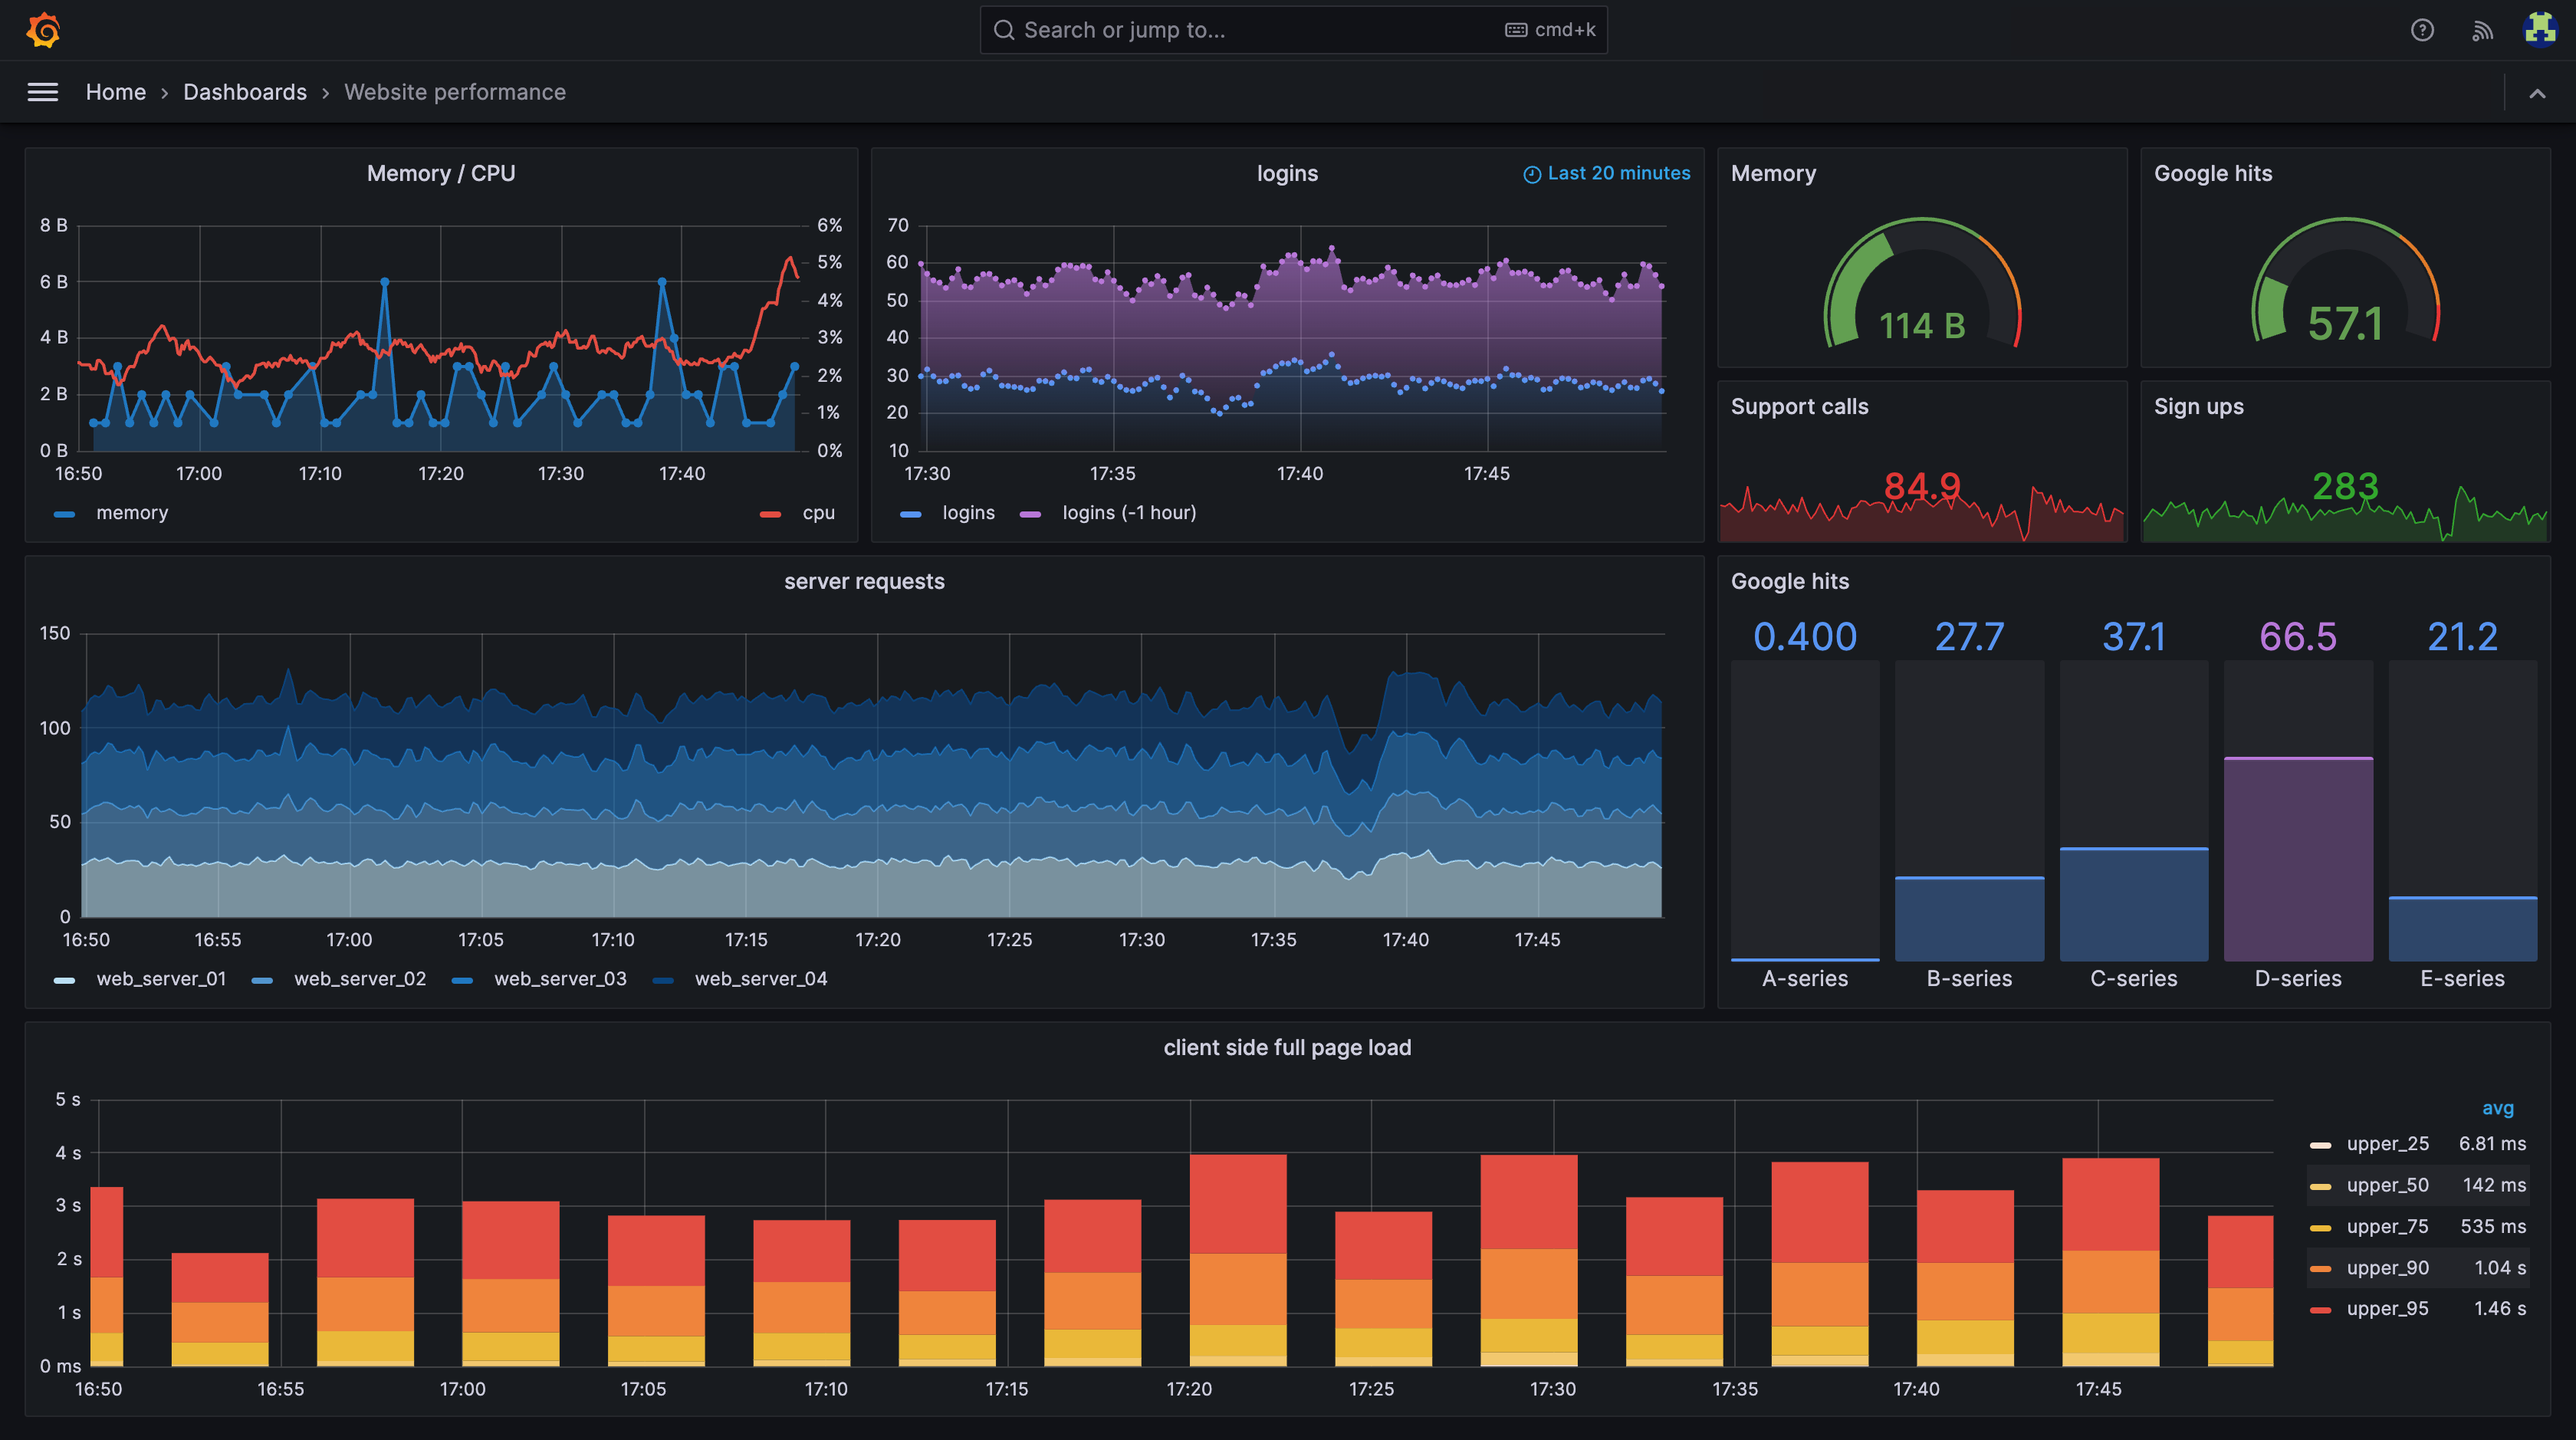
Grafana, paired with Prometheus and other data sources, enables us to monitor the health of our systems in real time. With customized dashboards, we track metrics like:
CPU Usage: We set alert rules for high CPU utilization, helping us quickly address performance bottlenecks before they affect user experience.
RAM Usage: Memory consumption is a crucial metric, and we’ve set thresholds to alert us when RAM usage spikes, ensuring that we can scale resources or optimize processes accordingly.
Disk Space: Our Grafana alerts notify us when disk usage crosses critical thresholds, so we can proactively manage storage capacity and avoid disruptions.
Security Updates: Keeping our systems secure is a top priority. Grafana helps us track the status of security patches and updates, triggering alerts when updates are pending or have failed.
Health Checks: Our dashboards also display the status of essential services, ensuring all systems are running smoothly. If something goes wrong, we get instant notifications.
SSL Checks: We monitor SSL certificates for expiration and integrity, making sure our connections are secure and preventing any disruptions in service.
By setting up customized alerts for these key areas, we ensure that we stay ahead of any issues that might impact system performance or security.
Log Monitoring
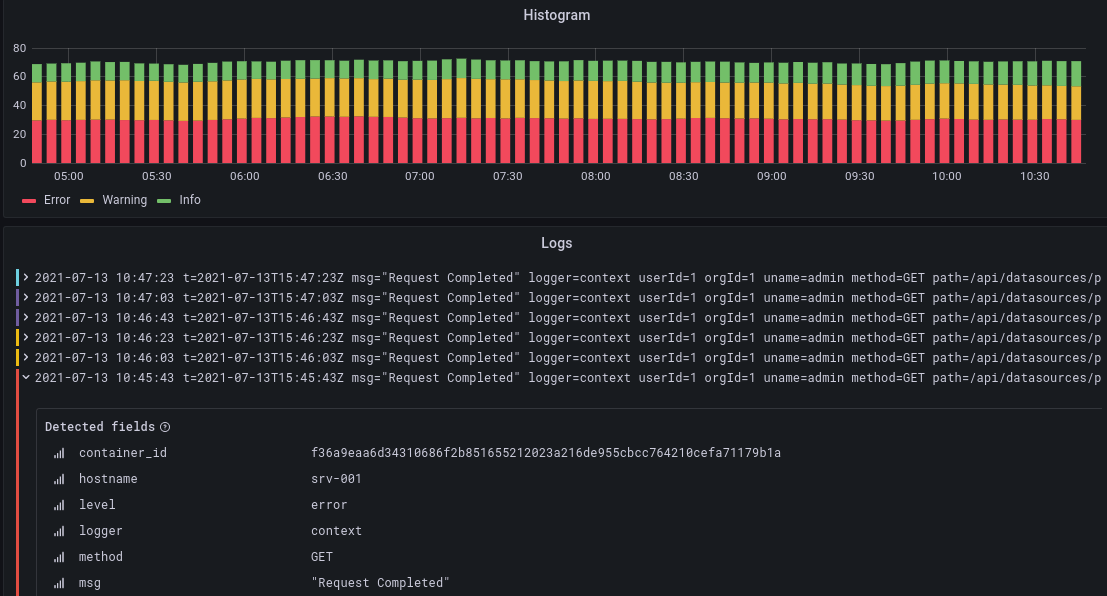
Monitoring logs is another critical function in our setup. Grafana integrates seamlessly with tools like Loki, allowing us to centralize log data and analyze them alongside our performance metrics. This helps us detect anomalies, trace errors, and understand the root cause of issues across different services and applications. Whether it's application logs or security-related logs, having everything in Grafana makes it easier to see what's going on across our entire system.
Business Analytics Dashboards
Grafana is not just for system monitoring; it’s also great for tracking key business metrics. We’ve set up dashboards that allow us to see things like:
Orders: We track the number of orders, broken down by categories, time periods, or other dimensions, allowing us to spot trends and optimize operations accordingly.
Revenue: By visualizing revenue over time, we gain insights into sales performance, helping us to forecast future growth, identify dips, and adjust strategies accordingly.
KPIs and Metrics: Grafana gives us the flexibility to build custom dashboards for different teams, making sure everyone has access to the metrics they need to do their job effectively.
Having all this data in one place is a huge time-saver. We don’t need to jump between different tools, and we can make data-driven decisions instantly.
Unified Alerts for Business and Operations
One of the best aspects of Grafana is its ability to centralize alerts from various sources. We’ve set up a single Slack channel to receive all alert notifications, whether they are related to system performance (like CPU or RAM usage) or business metrics (like a sudden drop in orders). This ensures that our team can quickly respond to issues across different areas of the business, without having to jump between multiple platforms.
Scalability and Flexibility
Grafana’s ability to scale is another key advantage. As our company grows and our infrastructure becomes more complex, Grafana’s flexibility ensures that we can add new data sources, metrics, and dashboards without any significant disruptions. Whether it’s monitoring additional servers, integrating new business applications, or adding new performance metrics, Grafana grows with us.
Conclusion
Grafana has become an indispensable tool in our company for monitoring and analyzing everything from system health to business performance. Its powerful alerting system, customizable dashboards, and flexibility make it the ideal solution for both our operational and business needs. By leveraging Grafana, we’re able to respond faster to issues, make data-driven decisions, and keep everything running smoothly.